
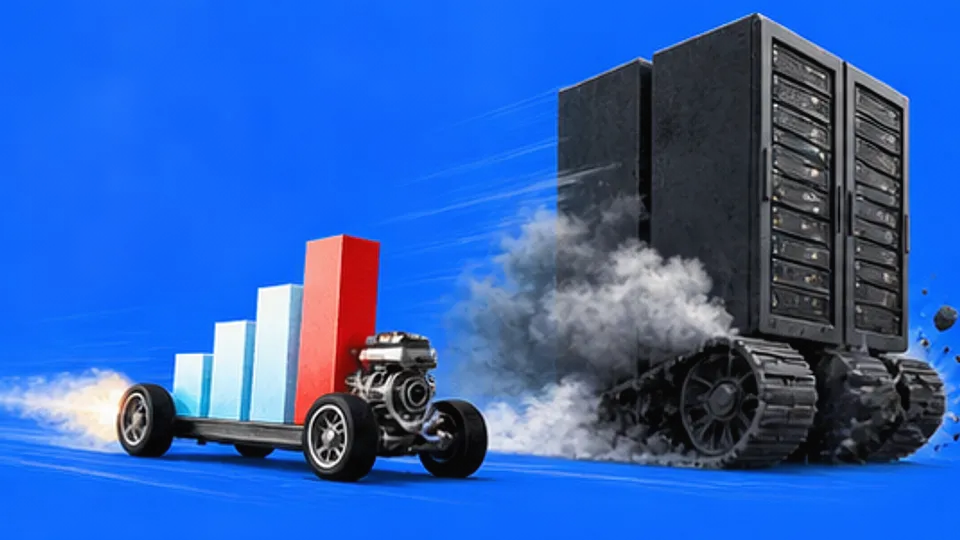
The artificial intelligence industry has been running on a single, conveniently purchasable belief: that intelligence scales with size, and size can be bought by the rack. Bigger model, more parameters, more compute, bigger invoice—it is a theology with a procurement department attached. So it is always worth pausing when a research team, even one publishing on a company blog, reports that the smaller machine beat the bigger machine at the one thing bigger machines are supposed to be better at: figuring things out.
In this case the team is at Amazon, writing on Amazon Science, and their recipe is called Chart-RL. The problem they’re solving is genuinely unglamorous and genuinely hard: chart question answering, the business of looking at a bar graph or a scatter plot and answering a question about it. Current vision-language models—VLMs, the systems that process images and text together—are curiously bad at this. They misread numbers, they miss relationships implied by visual layout, and their attention mechanisms wander off like conference attendees toward the coffee. Any human who has squinted at a quarterly earnings chart and extracted the wrong figure will recognize the species.
The proposed fix is reinforcement learning—policy optimization applied to the reasoning itself rather than another dump of training data. The model answers chart questions, gets rewarded for being right, and adjusts. The team coupled this with adaptive reward functions and with LoRA, a parameter-efficient fine-tuning technique whose main virtue is economic: it runs on a single GPU, which in this industry is roughly the equivalent of doing chemistry with a camping stove.
The headline number deserves the close reading the authors were surely hoping for. A Qwen3-VL-4B-Instruct model—the “4B” means 4 billion parameters, a toddler by current foundation model standards—fine-tuned with Chart-RL, scored 0.634 answer accuracy on the ChartQAPro benchmark. The same family’s 8-billion-parameter foundation model scored 0.580. Half the parameters, better answers. And faster: inference latency dropped from 31 seconds to 9 seconds, meaning the improved model also costs less time to actually use, which in deployment terms is the difference between a tool and a demo.
What the numbers don’t quite say
Some honesty is required here. A 0.634 accuracy is a system that answers nearly four chart questions out of ten incorrectly. Chart-RL is the best small model in its own comparison, and yet it would fail any class in which it were enrolled. The technique narrows the gap; it doesn’t close it.
There is also the matter of who is telling us this. Amazon Science publishes research, which is real, and marketing, which is also real, often in the same font. The comparisons here are internal: Qwen open models, benchmarked on ChartQAPro, with “competitive results” claimed against larger state-of-the-art systems—the kind of claim that gets one clause and no table. That doesn’t make the 4B-beats-8B finding false. It makes it a finding announced by the team that made it, pending anyone else’s ability to repeat it.
Still, the shape of the result matters beyond charts. Every quarter, the industry’s sales pitch to enterprises looking to deploy assistants is that useful capability requires frontier-scale models at frontier-scale prices. A study showing that a single GPU and a feedback loop can pull a cheaper half-size model past its bigger sibling—on a task that is essentially “reading business documents for money”—is a small crack in that pitch. Cracks like this accumulate.
Nobody at Amazon will put it this way, obviously. But a chart, as their own models are learning, is a machine for making one comparison legible. This one shows the expensive bar and the cheap bar, and the cheap bar is taller.