
72.7% is the accuracy a new Amazon model gets at sorting a road into one of three states: open, partially closed, completely closed. Guessing at random across three classes scores 33.3%, so the model is roughly double chance, not a solved problem. The result comes from a paper, posted on the company’s research site, Amazon Science, and accepted as an industrial paper at the 34th ACM SIGSPATIAL conference, which runs November 3–6, 2026 in Riverside, California.
The problem the paper is trying to solve is mundane and specific: routing software runs on a map, and a map of road closures goes stale the moment a city starts a construction project. Amazon’s own account of the pre-existing state of this problem, laid out when it introduced the in-van sensor system called Fleet Edge, is that a closure could take “several weeks” to reach routing software, during which drivers kept getting sent down a blocked street, as Amazon describes on its news site. Fleet Edge — an in-vehicle computer, a street-view camera and a GPS receiver, installed in delivery vehicles — was built to shrink that lag by capturing road changes the same day. Amazon says the system has already added more than 33,000 new road signs to its map data and increased GPS location accuracy by 260%, by its own account, not an independently audited figure.
Fleet Edge’s imagery feeds a bigger effort Amazon calls Wellspring, a generative-AI mapping system that, according to a company press release from September 21, 2026 announcing a further $1.9 billion for Amazon’s Delivery Service Partner program, has identified 202 million parking locations, mapped 2.8 million building entrances and catalogued 85,000 mailrooms and lockers since 2024. Those three numbers span four orders of magnitude, which says more about how unevenly distributed the mapping targets are — every address has roughly one building entrance, far fewer have a dedicated mailroom — than about any single rate of progress.

How the closure model works
The SIGSPATIAL paper, whose full text Amazon has posted as a PDF, narrows the closure problem to something a model can be scored on. It takes in three kinds of input for a given stretch of road: the road network itself, represented as a graph where intersections are nodes and street segments are the edges connecting them; satellite imagery, with detections lifted from street-level photos projected onto it; and street-view images of the same location. Each input type gets its own encoder — a neural network tuned to that data’s structure, since a photo and a graph don’t share a native representation — and the three encoded streams are then combined with what the authors call cross-modal transformer attention, letting the model weigh, say, a cone visible in a street-view photo against the shape of the road segment it sits on.
On top of that, the model uses graph message passing, where each node in the road-network graph updates its own state by pooling information from its neighbors, so a detected obstruction on one segment can propagate evidence to the segments connected to it, and edge-aware pooling, which weights that neighbor information by the properties of the connecting road segment rather than treating every link the same. The authors’ ablation tests — runs of the model with one component removed at a time — found all three mechanisms, the cross-modal attention, the edge-aware pooling and the graph message passing, measurably necessary; dropping any one hurt accuracy, according to the paper.
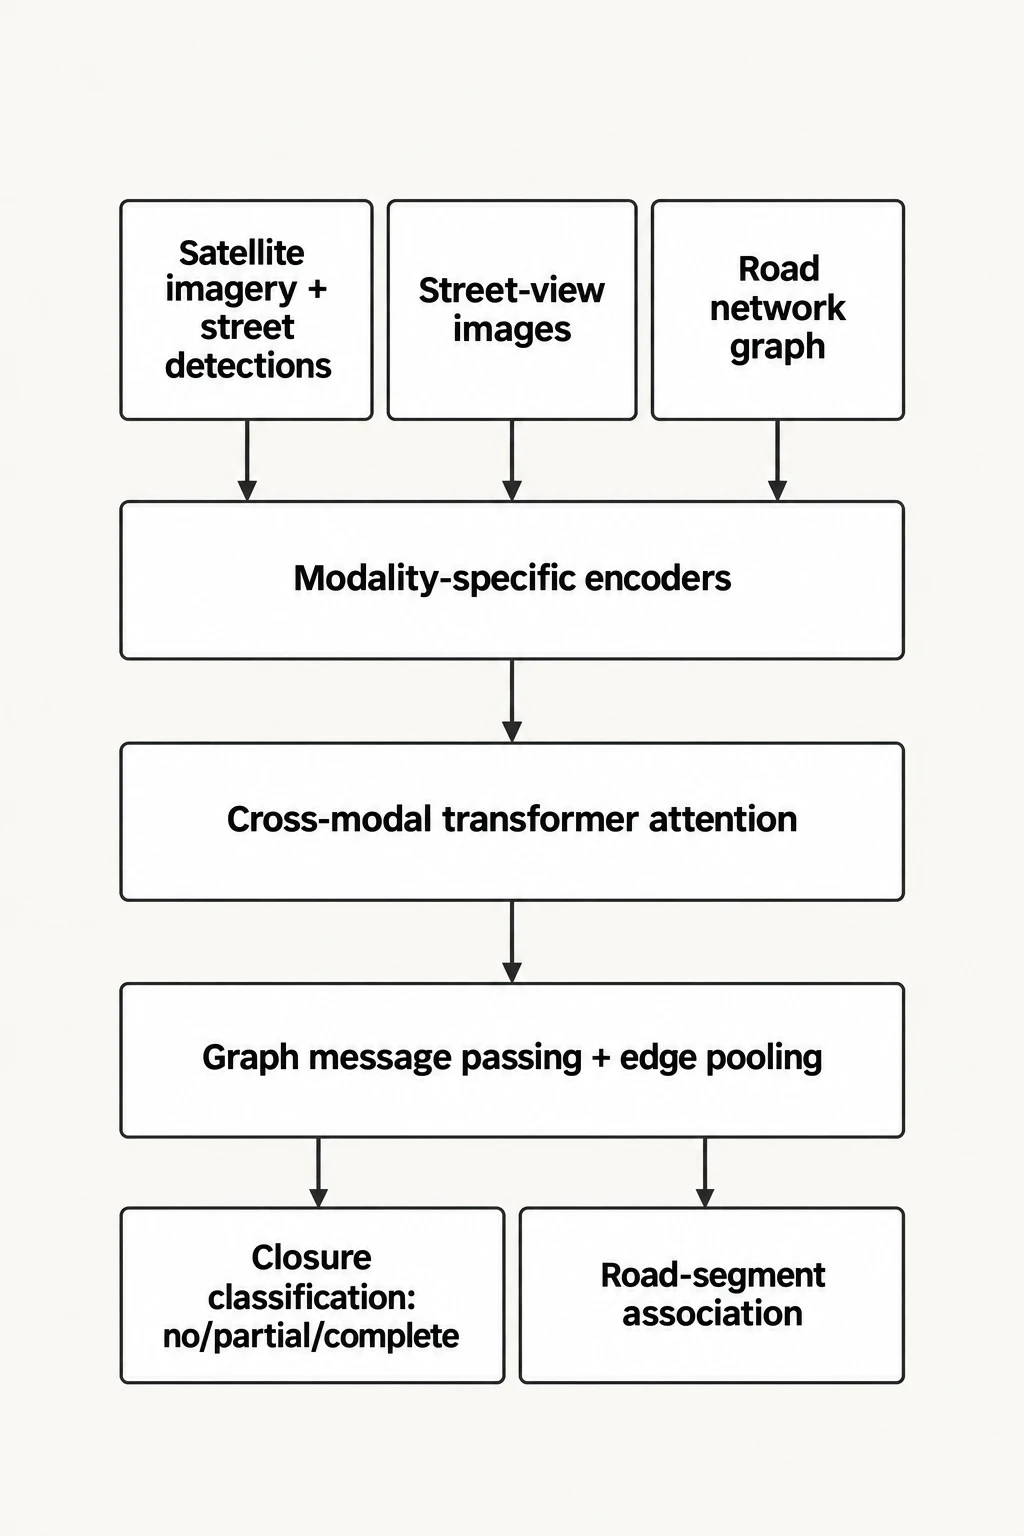
| From | To | How |
|---|---|---|
| Satellite imagery + street detections | Modality-specific encoders | |
| Street-view images | Modality-specific encoders | |
| Road network graph | Modality-specific encoders | |
| Modality-specific encoders | Cross-modal transformer attention | |
| Cross-modal transformer attention | Graph message passing + edge pooling | |
| Graph message passing + edge pooling | Closure classification: no/partial/complete | |
| Graph message passing + edge pooling | Road-segment association |
Based on Amazon Science
Two numbers, one new benchmark
The model is trained to do two things at once: classify a scene into one of the three closure states, where it scores 72.7%, and identify which specific road segment in the graph a closure applies to, where it scores 60%. The second number has no prior benchmark to be measured against — the paper states it is the first to combine closure classification with segment-level attribution in one evaluated task, so 60% is a starting point, not a result that can yet be called good or bad relative to other published work. Both figures come from testing on “nearly 20,000 real-world scenarios,” in the paper’s own wording, collected from what it describes only as “a large-scale commercial vehicle fleet.” The paper does not name the fleet, but the sensor description — street-level imagery paired with GPS and map data, gathered at delivery-route scale — matches the Fleet Edge hardware Amazon has already deployed across its own delivery vans, which makes Amazon’s last-mile network the likeliest source, though the paper stops short of saying so directly.
The paper also claims its model beats “frontier vision-language models” on closure classification by more than 28 percentage points, while being more than 4,000 times smaller and more than 100 times faster at inference. None of those three multipliers come with a denominator in the materials Amazon has published: no named baseline model, no parameter count for either side of the comparison, no absolute latency in milliseconds. A reduction of over 4,000x is plausible on its face — general vision-language models compared against map-reasoning tasks elsewhere in the literature typically run from several billion to hundreds of billions of parameters, while a bespoke encoder-plus-graph-network built for one structured task can run several orders of magnitude smaller — but plausible is not verified, and the comparison, as released, can’t be checked against a public number.

The business case for building a smaller, task-specific model rather than calling a general one is straightforward even without the exact figures: inference at delivery-fleet scale means millions of calls a day, and a model 100 times faster changes what’s economical to run on every route update rather than on a nightly batch. That logic matches the operational pressure visible elsewhere in Amazon’s delivery network — a report finding Amazon vans drew roughly 14,000 New York traffic citations underscores how much routing and curb-access friction already exists on the ground that better map data might reduce. Amazon’s September 2026 announcement folds the closure problem into the same push: dynamic hazard alerts in the Amazon Delivery app now warn drivers of accidents, closures and construction ahead on their route, and navigation is meant to adjust automatically rather than waiting for a driver to notice.
What the SIGSPATIAL paper does not include is a release of its 20,000-scenario dataset or its baseline comparisons in checkable form, and it does not say what fraction of those scenarios come from US delivery routes specifically, which matters for whether 72.7% and 60% hold up on street layouts and signage conventions outside the markets Amazon’s vans already cover. The next number worth watching is whether that benchmark, or a version of it, becomes public enough for anyone outside Amazon’s Last Mile team to reproduce the 28-point gap against a named general-purpose model.